Welcome! This online textbook is a living project. Content is being added and refined weekly as we build a complete resource for General Chemistry I & II. Thank you for visiting!
test2
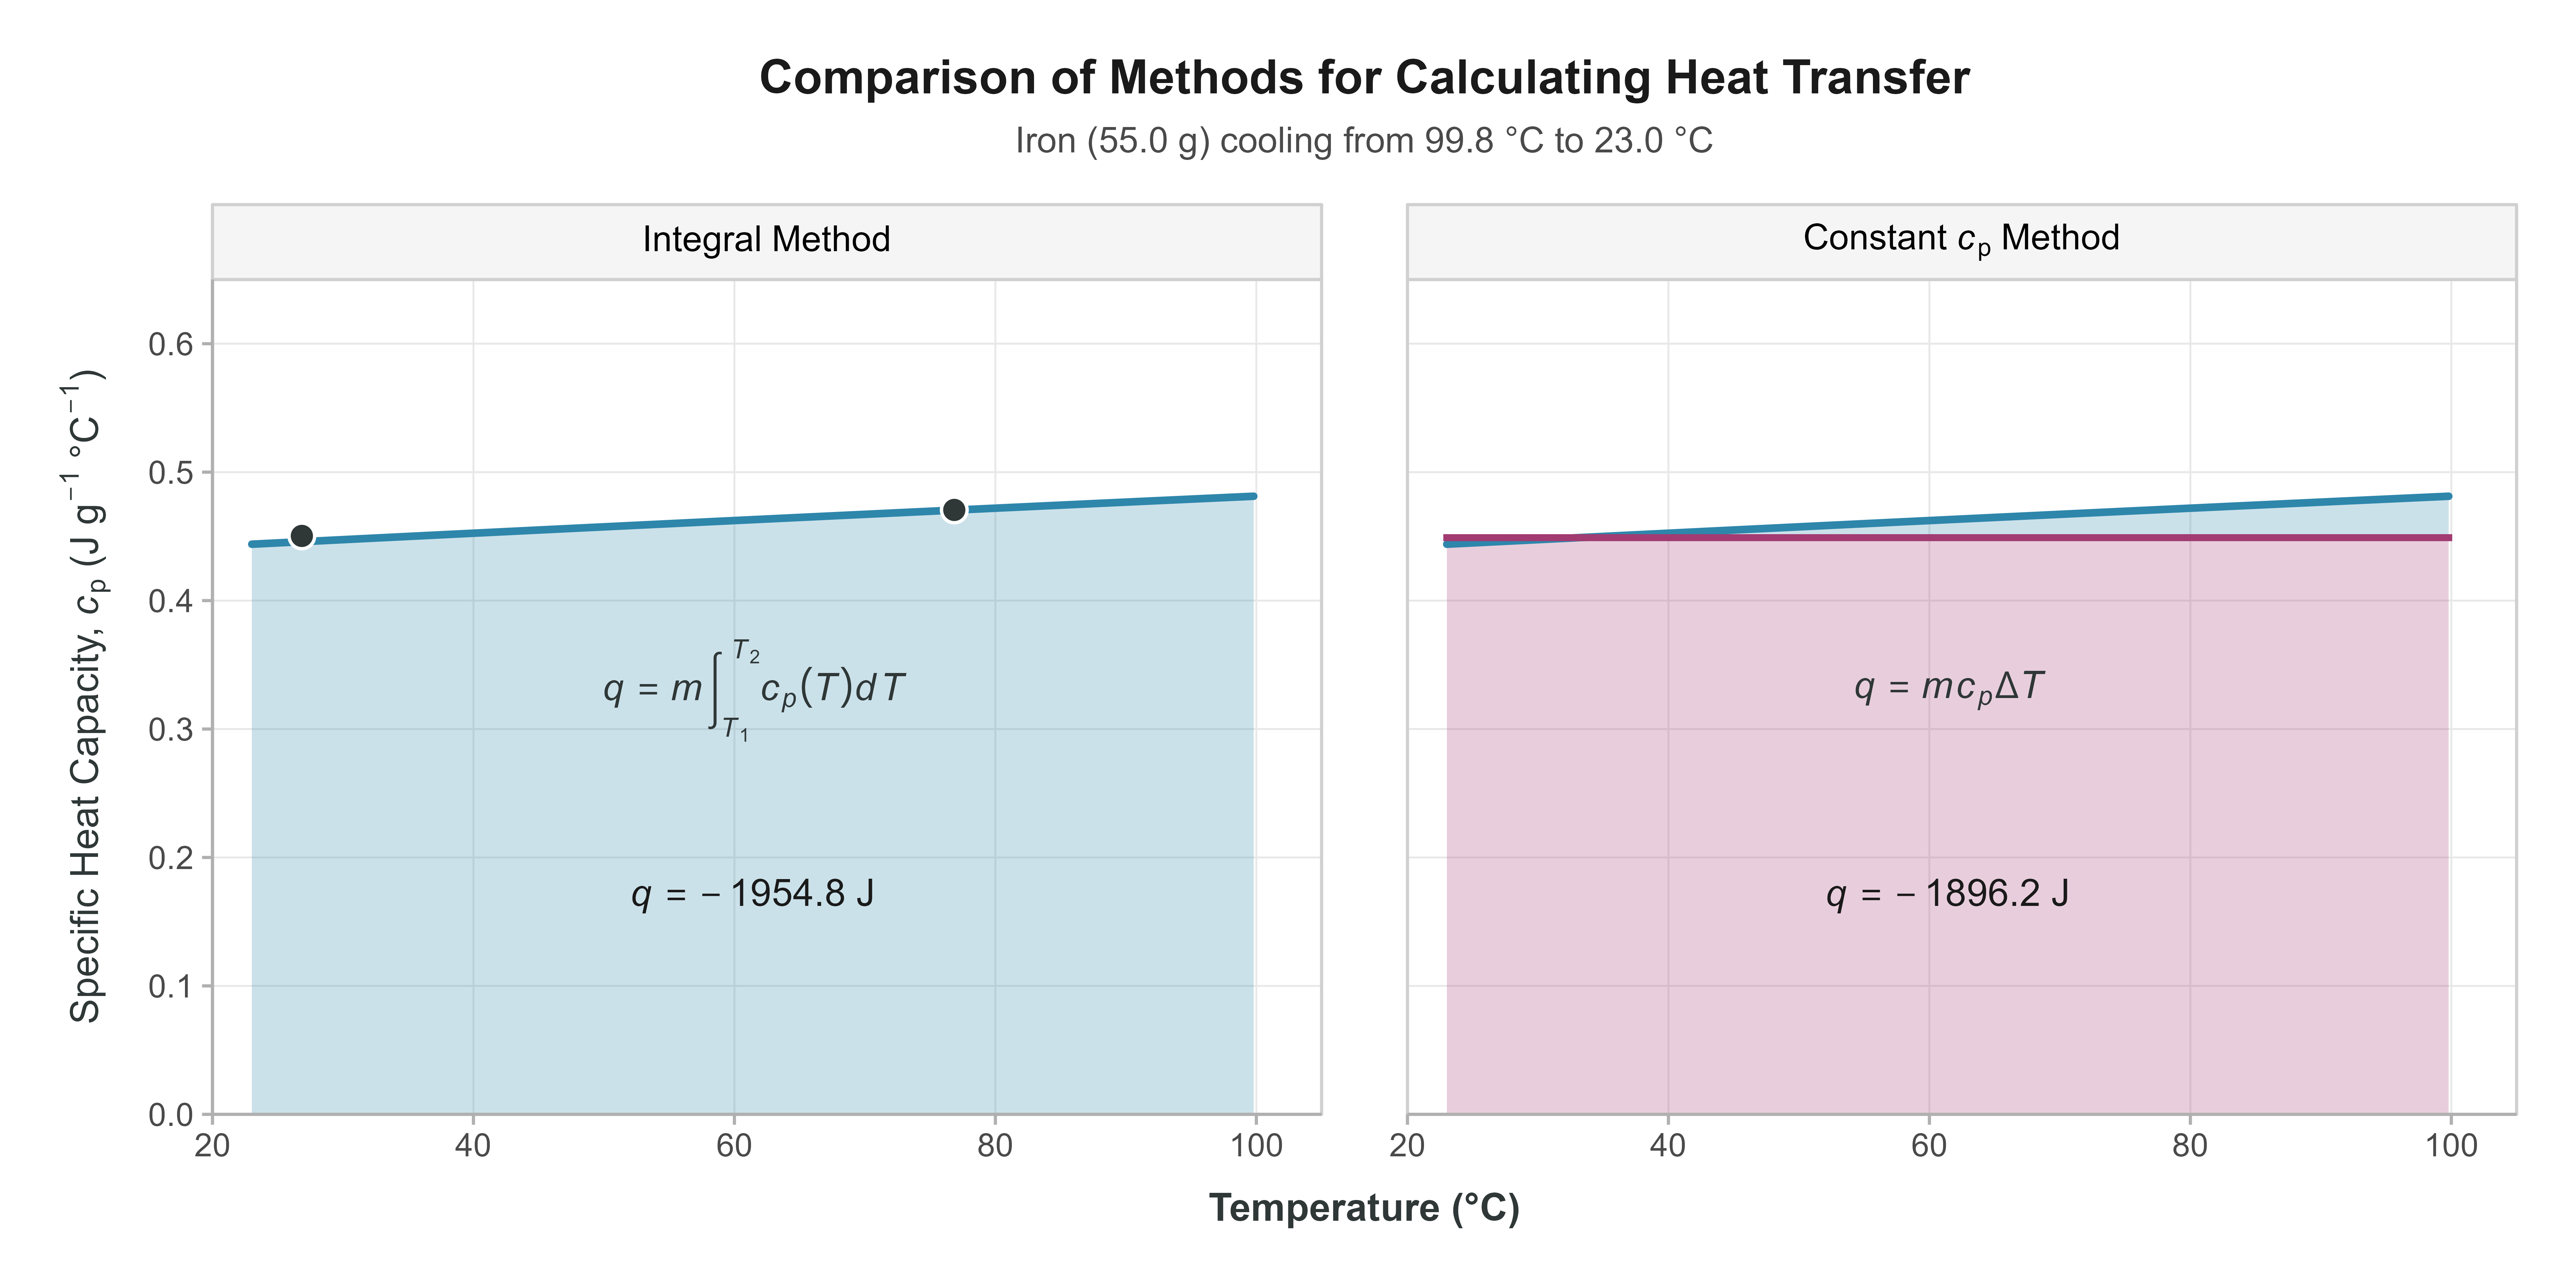
Figure 1: A comparison of two methods for calculating the heat transferred from a 55.0 g piece of iron as it cools from 99.8 °C to 23.0 °C. The left panel shows the rigorous integral method, with the discrete data points used to generate the curve. The right panel shows the common algebraic approximation using a constant specific heat capacity.